Weather forecast issued Sunday, November 5, 2023

Check out the Field of Honor, honoring those who have served and sacrificed, from November 5 -11. This is located in Garrison Park at 542 4th St.

MM’s Local Weather Concerns
Dry conditions have increased the wildfire danger.
Drought conditions continue to worsen.
MM’s 5-Day Forecast

YouTube
Youtube vidoes are published separately from this blog now. They are not published daily like this blog is but will become more frequent during times of threatening weather. My YouTube channel can be found at https://www.youtube.com/channel/UCz3zLMT7tqpb6eIaE-8YGog You can subscribe to that channel for free.
Yesterday’s Weather Statistics

NWS Climate Summary for October

On This Day
1977 – A slow moving storm produced five to nine inch rains across northern Georgia causing the Toccoa Dam to burst. As the earthen dam collapsed the waters rushed through the Toccoa Falls Bible College killing three persons in the dorms. Thirty-eight persons perished at a trailer park along the stream.
1988 – A powerful low pressure system produced high winds from the Great Plains to New England, and produced heavy snow in northern Wisconsin and Upper Michigan. Winds gusted to 64 mph at Knoxville, Tennessee, and reached 80 mph at Pleasant Valley, Vermont.
Drought Monitor
The Drought Monitor is updated each Thursday. The map below was updated on Thursday, November 1. Drought continues to intensify across the state. Now, portions of the plateau have been upgraded to extreme drought.

Last week’s map is seen below.
Notice how much the extreme drought category expanded from last week to this week.

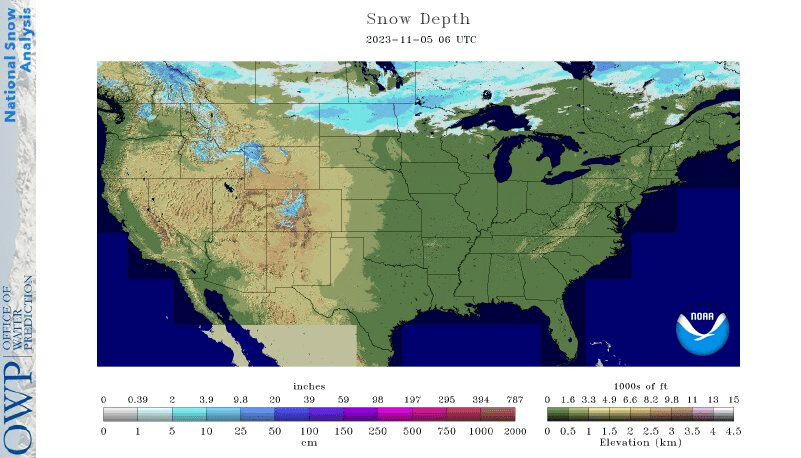
Nation’s Current Snowfall Depth
48-Hour Jetstream Forecast
Jet streams are relatively narrow bands of strong wind in the upper levels of the atmosphere, typically occurring around 30,000 feet in elevation. Within jet streams, the winds blow from west to east, but the band often shifts north and south because jet streams follow the boundaries between hot and cold air. Since these hot and cold air boundaries are most pronounced in winter, jet streams are the strongest during both the northern and southern hemisphere winters.
This map moves in 6-hr increments, beginning at 6:00 a.m. this morning, which is forecast hour 18. The brighter the reds, the stronger the winds at 30,000 feet.

48-Hour 500-mb Map
The 500 millibar (mb) map plots a variety of information collected by weather balloons and represents atmospheric conditions at an altitude of approximately 18,000 feet. These maps, like the jet stream maps, provide a good snapshot of what is occurring in the atmosphere above and can be especially useful in the winter and spring. This map moves in 6-hr increments, beginning at 6:00 a.m. this morning, which is forecast hour 18.


